EmpiricalTen • Kathmandu, Nepal 100 Ways to Earn Money from Nepal — Work From Home for Students & Professionals Curated Nepal-friendly options + trusted platforms + how to get paid (Payoneer, local bank, eSewa/Khalti). Bookmark and share. 100 ideas you can start this week 30+ links jobs, freelance & marketplaces SEO-ready for Google & social Copy Hashtags A) Freelancing & Tech B) Design & Creative C) Writing & Translation D) Marketing & Sales E) Teaching & Tutoring F) Content Monetization G) E-commerce & Reselling H) Microtasks & Labeling I) Finance & Admin J) Local-from-home A) Freelancing & Tech Web development (React/Next.js) for SMEs in Kathmandu WordPress + WooCommerce store setup Shopify customization & product uploads Mobile app dev with Flutter (Android/iOS) ...
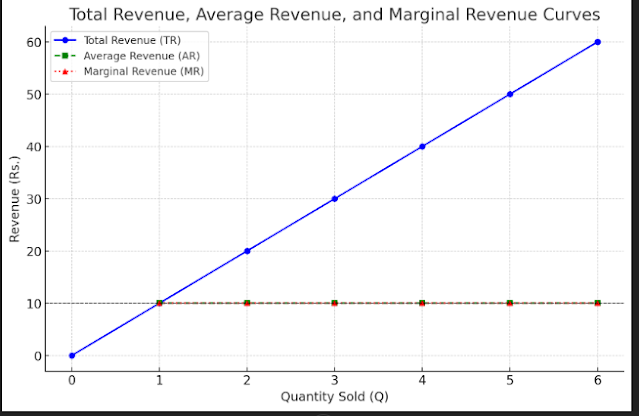
Graphical Representation of TR, AR, and MR with Detailed Explanation To understand Total Revenue (TR), Average Revenue (AR), and Marginal Revenue (MR) more effectively, we will make a schedule (table) and then plot a graph (curve) to visualize their relationship. Step 1: TR, AR, and MR Schedule (Table Format) Quantity Sold (Q) Price per Unit (P) Total Revenue (TR = P × Q) Average Revenue (AR = TR ÷ Q) Marginal Revenue (MR = ΔTR ÷ ΔQ) 0 10 0 - - 1 10 10 10 10 2 10 20 10 10 3 10 30 10 10 4 10 40 10 10 5 10 50 10 10 6 10 60 10 10 Key Observations from the Table : TR (Total Revenue) is increasing as more units are sold. AR (Average Revenue) remains constant at Rs. 10, which is equal to the price of the product. MR (Marginal Revenue) is also constant at Rs. 10, meaning each additional unit sold adds Rs. 10 to the total revenue. This is a perfectly competitive market , where AR = MR = Price . Step 2: Graph ...

Comments
Post a Comment