Graphical Representation of TR, AR, and MR with Detailed Explanation For NEB Grade 12 Economics, Management
Graphical Representation of TR, AR, and MR with Detailed Explanation
To understand Total Revenue (TR), Average Revenue (AR), and Marginal Revenue (MR) more effectively, we will make a schedule (table) and then plot a graph (curve) to visualize their relationship.
Step 1: TR, AR, and MR Schedule (Table Format)
| Quantity Sold (Q) | Price per Unit (P) | Total Revenue (TR = P × Q) | Average Revenue (AR = TR ÷ Q) | Marginal Revenue (MR = ΔTR ÷ ΔQ) |
|---|---|---|---|---|
| 0 | 10 | 0 | - | - |
| 1 | 10 | 10 | 10 | 10 |
| 2 | 10 | 20 | 10 | 10 |
| 3 | 10 | 30 | 10 | 10 |
| 4 | 10 | 40 | 10 | 10 |
| 5 | 10 | 50 | 10 | 10 |
| 6 | 10 | 60 | 10 | 10 |
Key Observations from the Table:
- TR (Total Revenue) is increasing as more units are sold.
- AR (Average Revenue) remains constant at Rs. 10, which is equal to the price of the product.
- MR (Marginal Revenue) is also constant at Rs. 10, meaning each additional unit sold adds Rs. 10 to the total revenue.
- This is a perfectly competitive market, where AR = MR = Price.
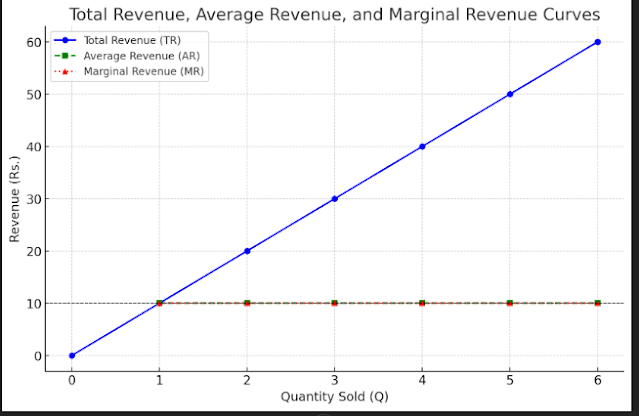
Step 2: Graph of TR, AR, and MR
Now, let's plot the TR, AR, and MR curves on a graph. The graph will have:
- Quantity Sold (Q) on the X-axis
- Revenue (Rs.) on the Y-axis
Graph:
Step 3: Detailed Explanation of the Graph
1️⃣ Total Revenue (TR) Curve (Blue Line)
- The TR curve starts at zero because when no quantity is sold, revenue is zero.
- It increases at a constant rate because the price remains constant at Rs. 10 per unit.
- The TR curve is a straight upward-sloping line, showing that each additional unit sold increases TR by the same amount (Rs. 10).
- In Perfect Competition, TR increases linearly since price is fixed.
2️⃣ Average Revenue (AR) Curve (Green Dotted Line)
- AR remains constant at Rs. 10 for all quantities.
- AR is calculated as TR ÷ Q, and since price remains constant in perfect competition, AR is equal to price.
- The AR curve is a horizontal straight line, meaning firms cannot influence price in perfect competition.
3️⃣ Marginal Revenue (MR) Curve (Red Dashed Line)
- MR is also constant at Rs. 10, which means every additional unit sold increases TR by Rs. 10.
- The MR curve is a horizontal line just like AR, showing that MR = Price in perfect competition.
- In monopoly or imperfect competition, MR would decrease as more units are sold, but in perfect competition, MR remains constant.
Step 4: Key Takeaways for Students
-
In Perfect Competition:
- AR = MR = Price (All are the same).
- TR increases at a constant rate (straight line).
- Firms are price takers, meaning they cannot charge different prices.
-
If This Were a Monopoly Market:
- MR would decrease as quantity increases, meaning the firm has to lower prices to sell more.
- TR would rise but at a decreasing rate.
-
Why Does This Matter?
- This helps businesses understand revenue patterns in different markets.
- Firms in perfect competition cannot charge more, so they must focus on efficiency.
- In monopoly or imperfect competition, pricing strategies matter more since MR ≠ AR.
💡 Final Tip: Always remember that in Perfect Competition, AR and MR are the same, while in Monopoly, MR falls below AR!

Comments
Post a Comment